Yves here. Even before Trump’s price-goosing tariffs are at risk of coming into play, key inflation metrics are going the wrong way.
By Wolf Richter, editor at Wolf Street. Originally published at Wolf Street
Inflation has been in services and is still in services, it has become sticky in services, and recently it has been re-accelerating in services. Services dominate consumer spending. And durable goods prices rose for the second month in a row, after big drops. But gasoline prices continued to plunge, and food prices ticked up just a little, according to the PCE price index by the Bureau of Economic Analysis today. This is the data the Fed prioritizes as yardstick for its 2% inflation target.
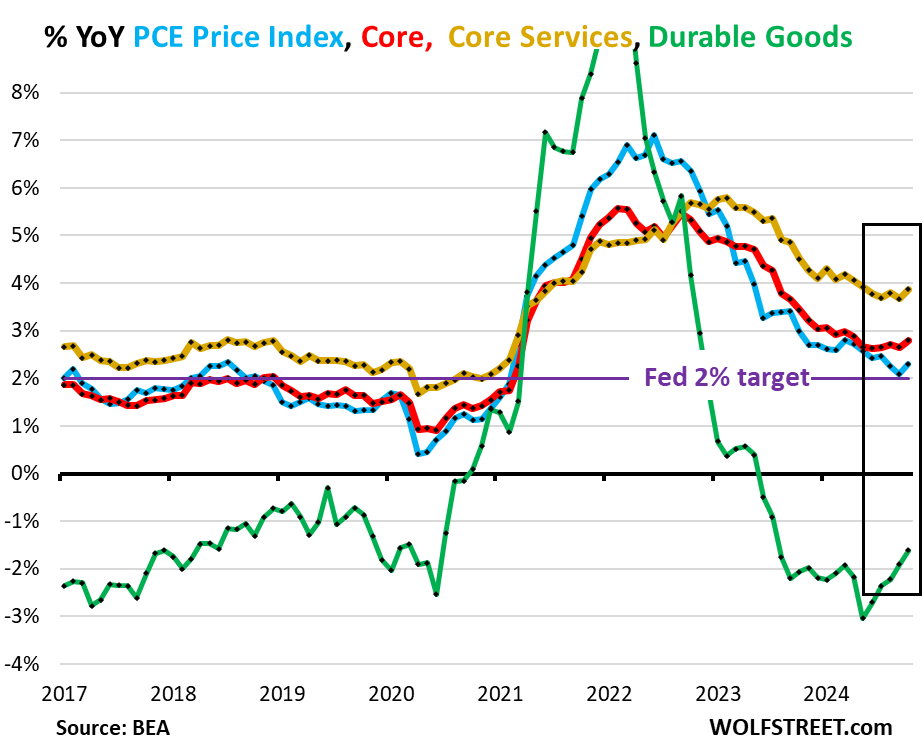
Three of the four major metrics accelerated in October even on a year-over-year basis: the overall PCE price index to +2.3% (blue), the “Core” PCE price index to +2.8%, (red), and the “Core Services” PCE price index to +3.9% (gold), while the durable goods PCE Price index started rising from the ashes and became less negative (green).
The Fed has already been talking down the pace of future rate cuts recently, including in the meeting minutes yesterday and in speeches by Fed governors.
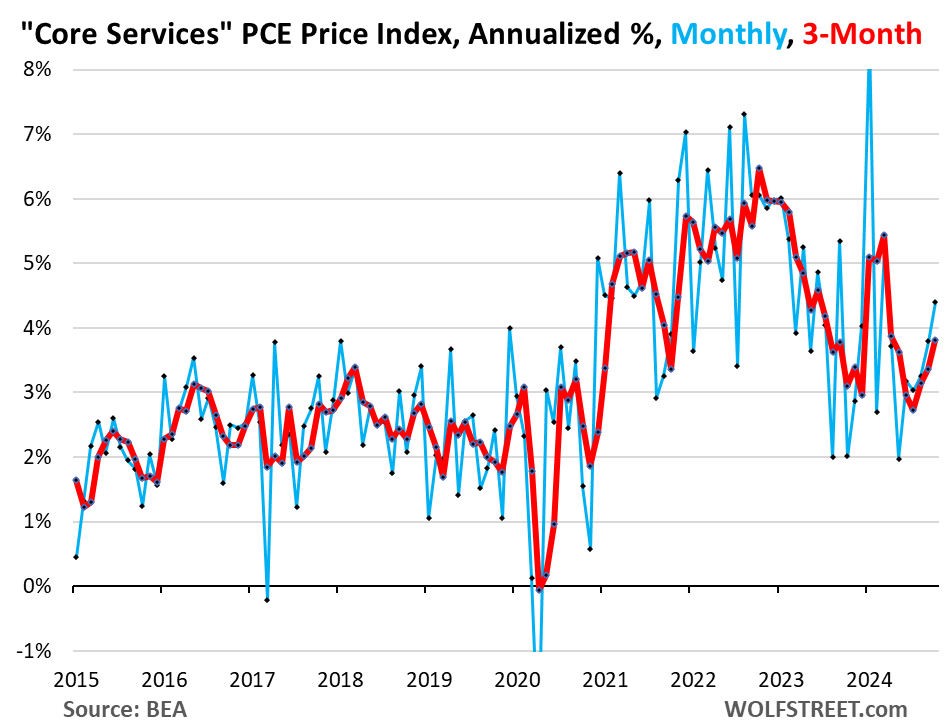
The driver: “Core Services.” The PCE price index for “core Services” accelerated to +4.4% annualized in October from September (+0.36% not annualized), the sharpest increase since March (blue in the chart below). The three-month core services index accelerated to 3.8% annualized (red).
Core services include housing, healthcare, financial services & insurance, transportation services, non-energy utilities, communication services, recreation services, food services & accommodation, and “other” services. But it excludes energy services, such as electricity to the home.
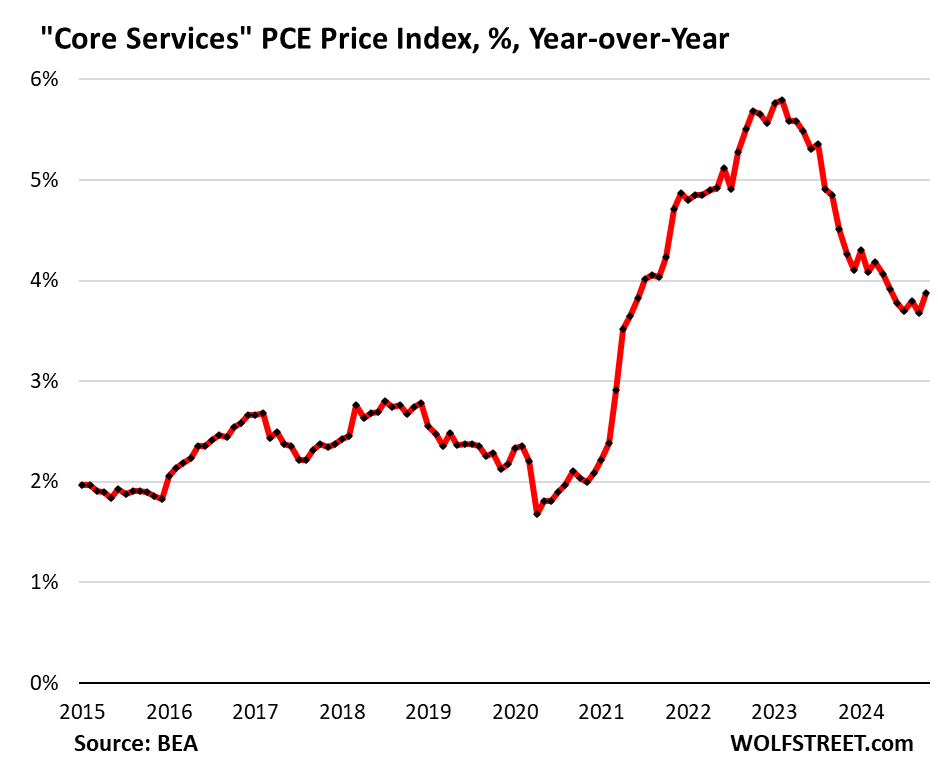
Year-over-year, core services PCE price index accelerated to 3.9%, the fastest increase since May. There has essentially been no progress since May:
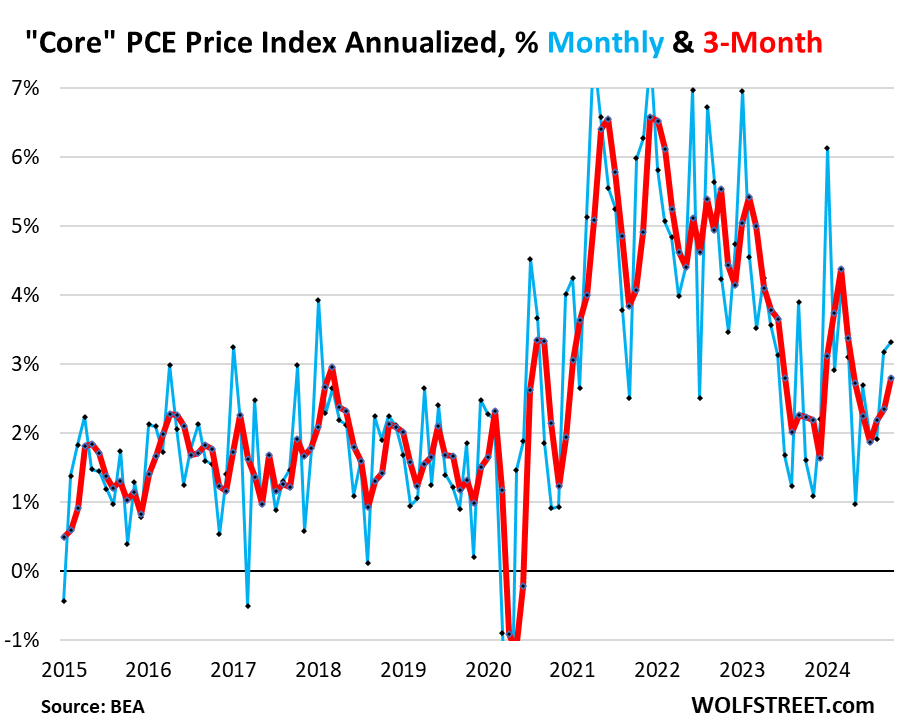
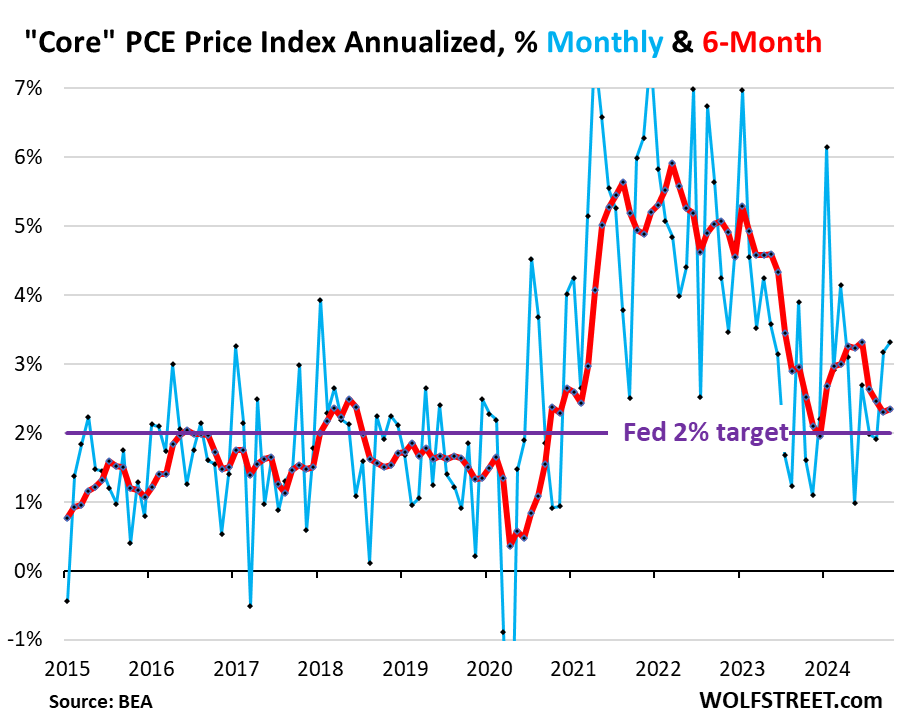
The “core” PCE price index accelerated to +3.3% annualized in October from September (+0.27% not annualized), the biggest month-to-month increase since March.
This month-to-month acceleration was driven by the jump in the core services PCE price index (see above).
The “core” index attempts to show underlying inflation by excluding the components of food and energy as they can jump and drop with commodity prices.
The 3-month core PCE price index accelerated to +2.80% annualized, the third acceleration in a row, and the fastest increase since April (red).
The 6-month core PCE price index accelerated to +2.34% annualized (red), and has remained higher all year than it had been at the end of last year:
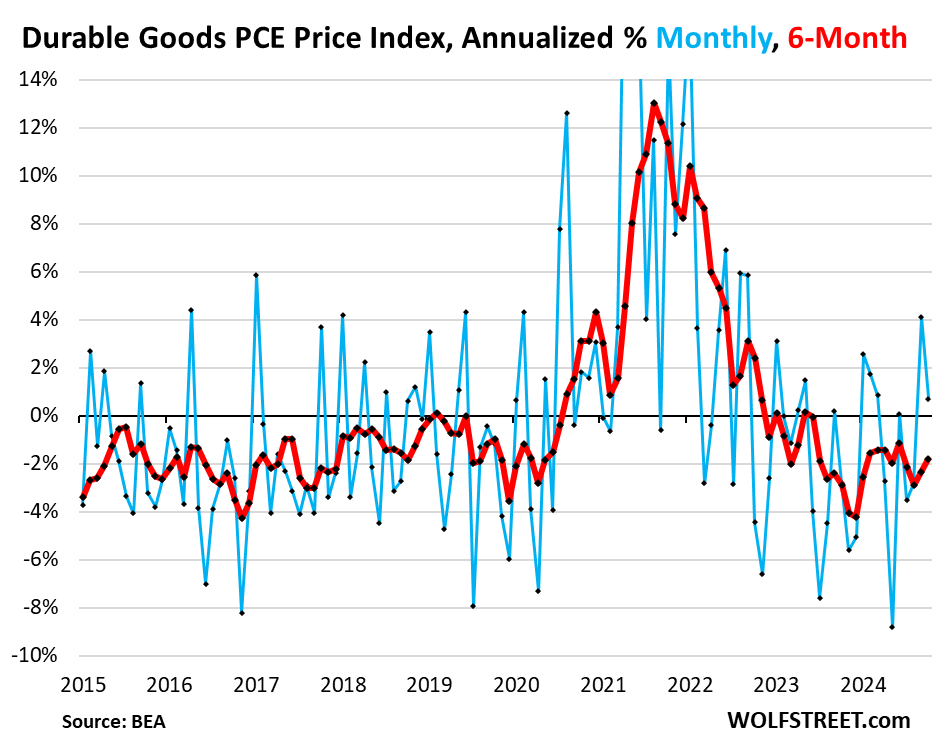
The durable goods PCE price index increased by 0.7% annualized (+0.06% not annualized) in October from September, on top of the big jump in August, which had been the biggest increase in two years, after a series of steep negative readings (deflation).
In October, the month-to-month increase was due to motor vehicles, while prices fell for household furnishings & appliances, recreational goods & vehicles, and “other” durable goods.
As a result, the 6-month index became less negative (-1.8%, red line).
And the year-over-year index also became less negative, see green line in first chart at the top (-1.6%).
In recent decades, durable goods prices trended lower on average due to manufacturing efficiencies, technological improvements, and offshoring production to cheap countries (globalization). Over these decades, the driving force in inflation has been services. During the pandemic, durable goods prices spiked due to the sudden demand fueled by massive economic stimulus that made consumers suddenly willing to pay whatever for goods, and there was huge demand for goods, overwhelming supply chains, giving companies enormous pricing power, and they used that pricing power:
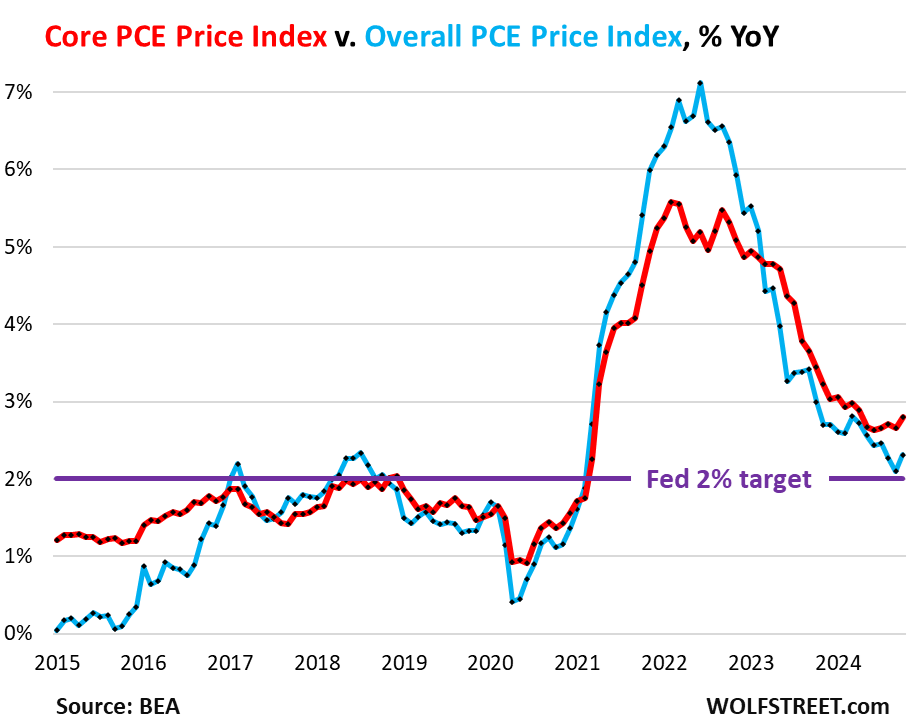
The overall PCE price index, which includes the food and energy components, rose by 2.3% year-over-year in October, an acceleration from September (+2.1%), despite the plunge in gasoline and other energy prices of -12.4% year-over-year and -1.0% month-to-month (not annualized).
Food and energy prices make up the difference between the overall PCE price index (blue) and the core PCE Price index (red). The price spikes of food and energy in 2021-2022 caused the overall PCE Price index to shoot to +7%, while the core PCE price index, which tracks the underlying inflation beyond commodities prices, topped out at 5.5%.
As energy prices have been plunging starting in mid-2022, the overall PCE price index decelerated faster than the core PCE Price index, leaving the core PCE price index with a higher rate.


Leave a Reply